반응형
타이타닉 데이터 분석 및 머신러닝 적용 목차
- [머신러닝 기초] 타이타닉 생존율 데이터 분석 - EDA #1 데이터 내용 및 객실등급(Pclass), 성별(Sex)확인
- [머신러닝 기초] 타이타닉 생존율 데이터 분석 - EDA #2 나이(Age)와 탑승위치(Embarked) 확인
- [머신러닝 기초] 타이타닉 생존율 데이터 분석 - EDA #3 형제자매,배우자(SipSp) 확인
- [머신러닝 기초] 타이타닉 생존율 데이터 분석 - EDA #4 데이터 정리 및 Feature Engineering
- [머신러닝 기초] 타이타닉 생존율 데이터 가공 - Machine Learning을 위한 데이터 처리 방법
- [머신러닝 기초] 타이타닉 생존율 모델링 - Predictive 모델링
- [머신러닝 기초] 타이타닉 생존율 분석 - Cross Validation
- [머신러닝 기초] 타이타닉 생존율 모델링 최적화 - 앙상블(Ensemble)
K-Fold Cross Validation은 처음에 dataset을 k-subset으로 나눈다.
만약 dataset을 5개의 subset으로 나눈다면 1개는 테스트용, 4개는 training용으로 사용한다. 루프를 돌면서 테스트하는 부분을 바꾸고, 다른 파트에서 알고리즘을 트레이닝 하면서 이러한 프로세스를 계속 수행한다. 정확도와 에러는 알고리즘의 평균 정확도를 얻어 평균값을 가지게 된다. 이러한 방식을 K-Fold Cross Validation이라고 한다. Underfit or overfit이 될 수 있다.
from sklearn.model_selection import KFold
from sklearn.model_selection import cross_val_score
from sklearn.model_selection import cross_val_predict
kfold = KFold(n_splits=10,random_state=22)
xyz = []
accuracy = []
std = []
classifiers=['Linear Svm','Radial Svm','Logistic Regression','KNN','Decision Tree','Naive Bayes','Random Forest']
models=[svm.SVC(kernel='linear'),svm.SVC(kernel='rbf'),LogisticRegression(),KNeighborsClassifier(n_neighbors=9),DecisionTreeClassifier(),GaussianNB(),RandomForestClassifier(n_estimators=10)]
for i in models:
    model = i
    cv_result = cross_val_score(model,X,Y,cv=kfold,scoring="accuracy")
    cv_result=cv_result
    xyz.append(cv_result.mean())
    std.append(cv_result.std())
    accuracy.append(cv_result)
new_models_dataframe2=pd.DataFrame({'CV Mean':xyz,'Std':std},index=classifiers)
new_models_dataframe2
위에서 여러가지 모델을 가지고 prediction을 한 것을 다 모아서 평균값과 표준편차를 구해본다. 표준편차가 제일 적은 것은 Logisitic Regression이고 제일 큰것은 Linear Svm인것을 알 수 있다.

box차트로 그림을 그려보면
plt.subplots(figsize=(12,6))
box=pd.DataFrame(accuracy,index=[classifiers])
box.T.boxplot()
Accuracy는 Radial Svm이 제일 높고 편차는 Logistic Regression이 적은 것을 눈으로 확인 할 수 있다.

평균값을 통한 Accuracy를 bar차트로 살펴본다.
new_models_dataframe2['CV Mean'].plot.barh(width=0.8)
plt.title('Average CV Mean Accuracy')
fig=plt.gcf()
fig.set_size_inches(8,5)
plt.show()
Random Forest와 Radial Svm이 높은 것을 확인할 수 있다.

Confusion Matrix
Classifier에 의해 만들어지는 많은 정확한/부정확한 classification을 만들어준다.
f,ax=plt.subplots(3,3,figsize=(12,10))
y_pred=cross_val_predict(svm.SVC(kernel='rbf'),X,Y,cv=10)
sns.heatmap(confusion_matrix(Y,y_pred),ax=ax[0,0],annot=True,fmt='2.0f')
ax[0,0].set_title('Matrix for rbf-SVM')
y_pred=cross_val_predict(svm.SVC(kernel='linear'),X,Y,cv=10)
sns.heatmap(confusion_matrix(Y,y_pred),ax=ax[0,1],annot=True,fmt='2.0f')
ax[0,1].set_title('Matrix for Linear-SVM')
y_pred=cross_val_predict(KNeighborsClassifier(n_neighbors=9),X,Y,cv=10)
sns.heatmap(confusion_matrix(Y,y_pred),ax=ax[0,2],annot=True,fmt='2.0f')
ax[0,2].set_title('Matrix for KNN')
y_pred=cross_val_predict(RandomForestClassifier(n_estimators=100),X,Y,cv=10)
sns.heatmap(confusion_matrix(Y,y_pred),ax=ax[1,0],annot=True,fmt='2.0f')
ax[1,0].set_title('Matrix for Random-Forests')
y_pred=cross_val_predict(LogisticRegression(),X,Y,cv=10)
sns.heatmap(confusion_matrix(Y,y_pred),ax=ax[1,1],annot=True,fmt='2.0f')
ax[1,1].set_title('Matrix for Logistic Regression')
y_pred=cross_val_predict(DecisionTreeClassifier(),X,Y,cv=10)
sns.heatmap(confusion_matrix(Y,y_pred),ax=ax[1,2],annot=True,fmt='2.0f')
ax[1,2].set_title('Matrix for Decision Tree')
y_pred=cross_val_predict(GaussianNB(),X,Y,cv=10)
sns.heatmap(confusion_matrix(Y,y_pred),ax=ax[2,0],annot=True,fmt='2.0f')
ax[2,0].set_title('Matrix for Naive Bayes')
plt.subplots_adjust(hspace=0.2,wspace=0.2)
plt.show()
그림에서 보이듯이 왼쪽의 베이지색은 올바른 prediction이며 오른쪽 검정색은 잘못된 prediction을 나타낸다. 예를 들어 rbf-SVM을 보면, 491(dead)+247(survived)이며 accuracy는 (491+247)/981=82.8%로 나타난다. 검정색 에러는 잘못된 classified된 58명의 죽은 사람이 survived로 나타는 것이며 94명의 survived가 죽은 것으로 보인다. 이것을 통해 우리는 rbf-SVM이 죽은 승객을 가장 잘 예측하는데 맞다고 보고, Naive Bayes가 Survived에 가장 잘 맞다라고 볼 수 있다.

Hyper-Parameters Tuning
머신러닝 모델은 Black-Box와 같아 default parameter값을 통해 수행되는데 더 나은 모델을 만들기 위해서 우리는 이러한 parameter들을 바꿔가며 튜닝을 할 수 있다.
SVM
from sklearn.model_selection import GridSearchCV
C=[0.05,0.1,0.2,0.3,0.25,0.4,0.5,0.6,0.7,0.8,0.9,1]
gamma=[0.1,0.2,0.3,0.4,0.5,0.6,0.7,0.8,0.9,1.0]
kernel=['rbf','linear']
hyper={'kernel':kernel,'C':C,'gamma':gamma}
gd=GridSearchCV(estimator=svm.SVC(),param_grid=hyper,verbose=True)
gd.fit(X,Y)
print(gd.best_score_)
print(gd.best_estimator_)
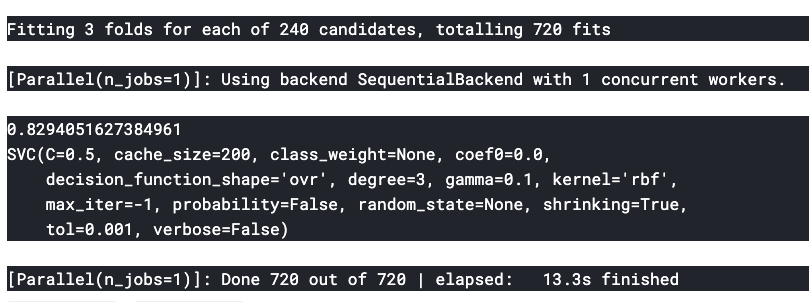
SVM모델에서 C와 gamma값을 변경시켜 감에 따라 더 좋은 모델을 얻을 수 있는지 확인한다. 최적의 값은 C=0.5, gamma=0.1로 나오는 것을 알 수 있다.

Random Forests
n_estimators=range(100,1000,100)
hyper={'n_estimators':n_estimators}
gd=GridSearchCV(estimator=RandomForestClassifier(random_state=0),param_grid=hyper,verbose=True)
gd.fit(X,Y)
print(gd.best_score_)
print(gd.best_estimator_)
n_estimators값을 100에서 1000까지 100단위로 넣어서 확인한다. n_estimators가 900일 때 최적의 값을 찾는 것을 알 수 있다.

* 해당 타이타닉 notebook은 Kaggle의https://www.kaggle.com/ash316/eda-to-prediction-dietanic분석을 그대로 따라하면서 나름대로 정리한 부분임을 밝혀둔다.
반응형


